Written by Jim….
If you are interested in my stints as a sugar beet semi driver read on.
I recently watched the most recent training video put out by Crystal Sugar for the factory workers (of which I am not, I work directly for one of the farmers, but the video contained some interesting facts).
The video centered on the beet harvest in the Red River Valley where I have worked in the past, and have signed up for again this yeas (2020). I just hope for the weather to be better than the last two years.

From the video.
5 factories.
36 piling locations.
107 separate piles, with machines called pilers to get the beets from the truck to the pile.
From 2 to 8 pilers per location.
Weather permitting, the harvest lasts from 10 to 15 days (or if weather does not cooperate, then like last year 40 days).
Average year crop is 12 million tons.
Average pile 100 thousand tons.
Piles are up 32 feet high, up to 120 feet wide, and up to one quarter mile long.

They harvest in October because on average it has the appropriate weather, not too hot, not too cold, not too wet, and not too windy. September is too hot, November too cold.

There are about 1400 temporary factory workers, about half of them RVers, coming in for the harvest, staying in 34 campgrounds.

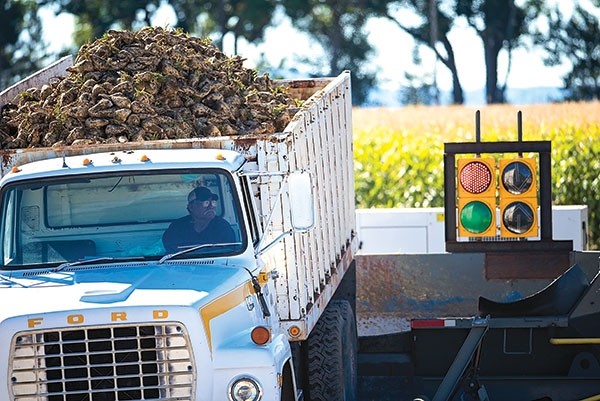
It takes about 600 thousand truck trips to bring the harvest in. That’s an average of 20 tons per truck.

Let’s do some math. Pilers go down several times per shift for maintenance, so I will calculate with 100 pilers, not 107 (it also makes the math easier).
10 day harvest
Assuming the minimum number of days to harvest, 10 days:
600k truck trips divided by the 10 day minimum = 60k trips per day.
60k trips per day divided by 100 pilers = 600 trucks per piler per day.
2 to 8 pilers per location times 600 trucks each = 1200 to 4800 trucks going in and out of each location. Which means in a 18 second to 72 second window a truck enters and another truck exits each location.
600 trucks per day divided by 24 hours = 25 trucks per hour so in 60 minutes that means 2.4 minutes unload time for each truck. Since each piler has two lanes that means 4.8 minutes per truck per piler lane. 2.4 to drive in/out, get ready, etc. and 2.4 to actually dump.
2.4 minutes times the 20 ton average load = 500 tons per piler per hour.
15 day harvest
Assuming the hoped for 15 day “maximum” let’s do the same math.
600k truck trips divided by the 15 day max = 40k trips per day.
40k trips per day divided by 100 pilers = 400 trucks per piler per day.
2 to 8 pilers per location times 400 trucks each = 800 to 3200 trucks going in and out of each location. Which means in a 27 second to 108 second window a truck enters and another truck exits each location.
400 trucks per day divided by 24 hours = 17 trucks per hour so in 60 minutes that means 3.5 minutes unload time for each truck. Since each piler has two lanes that means 5 minutes per truck per piler lane. 3.5 to drive in/out, get ready, etc. and 3.5 to actually dump.
3.5 minutes times the 20 ton average load = 343 tons per piler per hour.
The people.
The number of workers mentioned above only counts the people working at the factories running the pilers. It does not count the truck drivers, tractor drivers, mechanics, and other people in the fields required to pull this off. I can’t put a exact number on these people but using as a rule of thumb the number of loads per day we hauled in at the farm I worked on there are probably more than two truck drivers for each factory worker, and probably about an equal number of tractor drivers as factory workers. So I’m guessing that there are five to six thousand people required to get the harvest in ( since I originally wrote this I learned from another article that the estimated number of truck drivers is over 4000, with most farmers running two 12 hour shifts this means there are 2000 trucks on the road at all times). Plus the surrounding communities help support this effort by extending their work hours. You can get just about any part, supplies, etc. you need 24/7 with a quick phone call. Besides, they want to get it over with and get all the trucks (and sugar beets that fall off the trucks) off the road.
Lots of people, trucks, tractors, and other equipment all working together 24/7 over a short time span to bring you on average 55% of the sugar you eat.
So starting Oct. 1 (the official kick off date) at 12:01 a.m. (the official kick off time) send all your thoughts for good weather in the Red River Valley my way.
I hope you found this interesting. I know I did, and I have been in the middle of it!
Very Interesting and informative!
The sugar beet ends up in A variety of products
We would never imagine it’s impact!
Love learning more about world we live in.
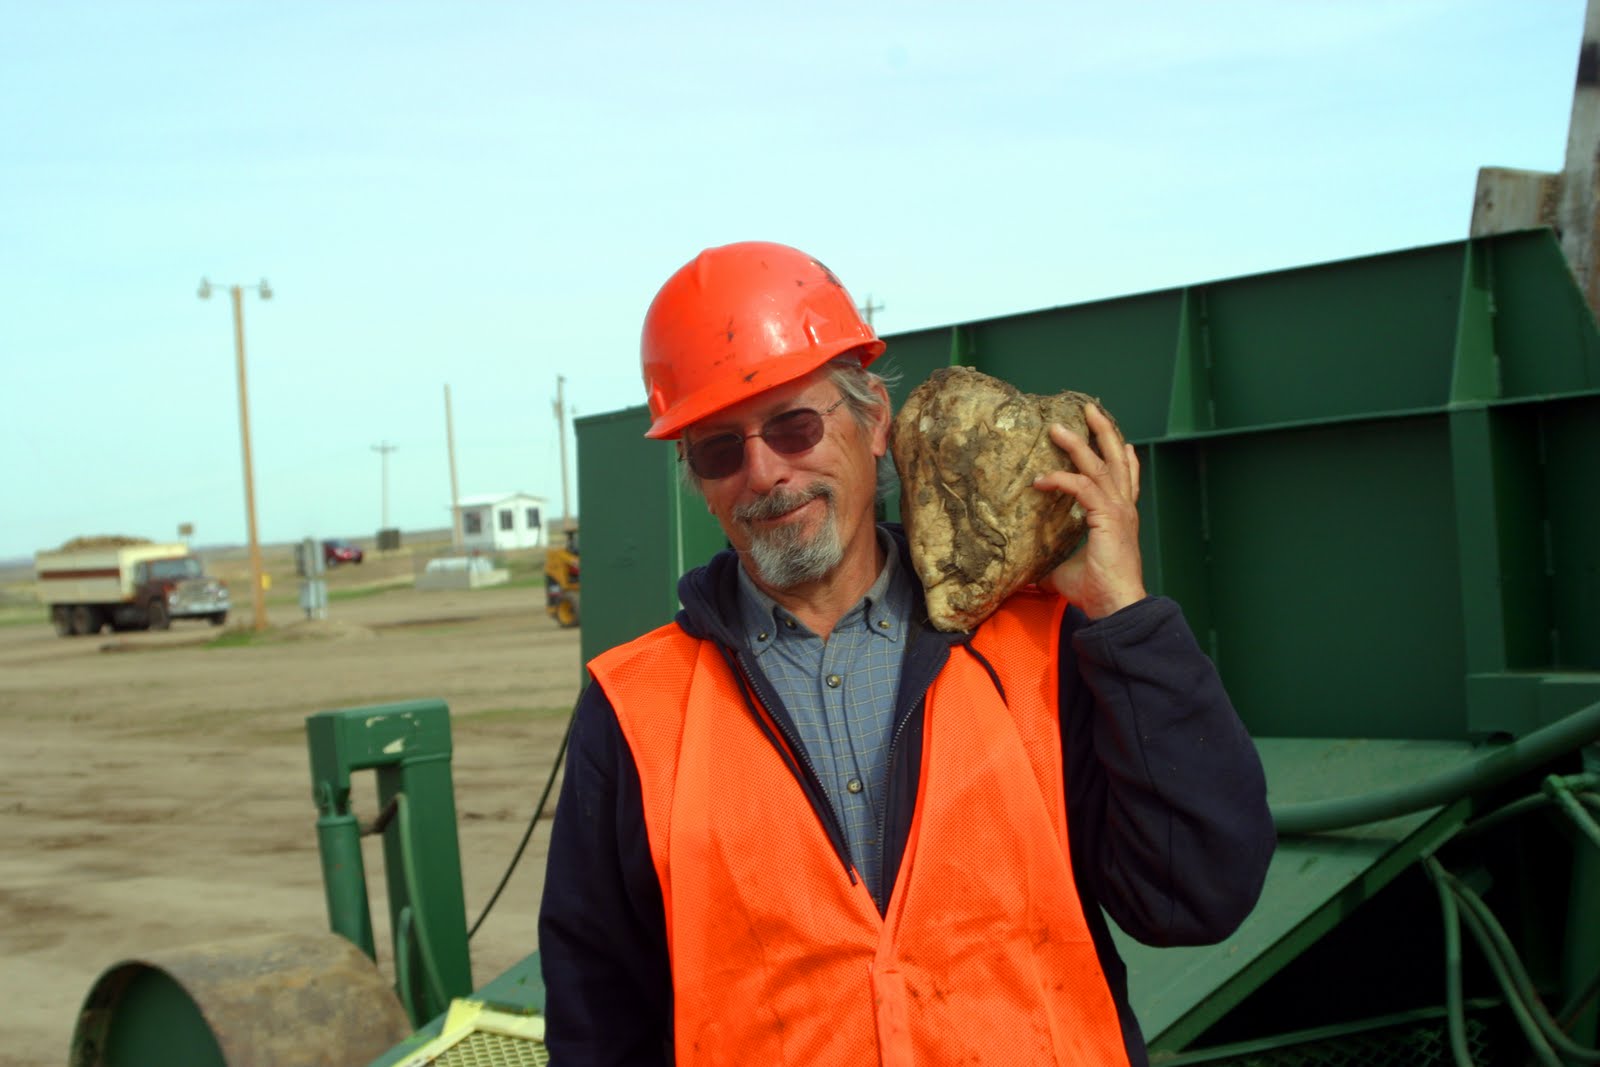
Whoa — some impressive statistics. Dumb me — I didn’t know what a sugar beet looked like. I just know the old fashioned ones that you grow in the garden 🙂
Who knew it was such a team effort to produce about 55% of the sugar consumed??? WOW! Thanks for all the eye-opening statistics and photos. Never knew what a sugar beet was; thanks for the education and enjoy the harvest!